Nuclear Magnetic Resonance Spectroscopy
Consider the magnetic properties of
an atomic nucleus. The nucleus of an atom spins and as a consequence,
if the charge is not symmetrically placed on the nucleus, the
spinning charge will constitute a circular current and will produce
an associated magnetic field similar to a small bar magnet. Not all
nuclei possess an asymmetric charge but among those that do are the
hydrogen and the 13C nuclei, which are the nuclei of major
importance for NMR spectroscopy. However, most elements or one of
their isotopes have their charge asymmetrically placed and, thus,
exhibit magnetic properties.
If the spinning nucleus is placed in
a strong external magnetic field, the nucleus can adopt a
small number of possible orientations. The hydrogen nucleus is
permitted just two orientations, which can be in the direction of the
magnetic field or opposite to the direction of the field. This
situation is depicted in figure 1.
Now if the nucleus is exposed to
radiation of frequency (ν)
and this causes the nucleus to ‘flip’ (see figure 1) then
the energy involved (ΔE)
will be given by.
ΔE = hν (1)
where (h) is Plank’s
Constant
This is the
basis of Magnetic Resonance Spectrometry
When a hydrogen nucleus is placed
in a magnetic field the external field will act upon the spinning
nucleus to try to change its spinning axis to be in line with the
magnetic field.
Now when a
force acts upon a spinning body to change its axis of rotation then,
to conserve the angular momentum, the spinning body will precess.
The Precessing nucleus is depicted diagramatically in Figure 2.
From quantum rules, the Precessing
nucleus has only two possible orientations. Consequently, if energy
is supplied to the spinning nucleus, employing electromagnetic
radiation of the necessary frequency, energy will be absorbed and the
Precessing nucleus will be displaced from one orientation to the
other.
The magnetic quantum number for the
proton is ± 1/2 and consequently, the frequency (ν)
at which this transition can occur can be calculated from the
equation:
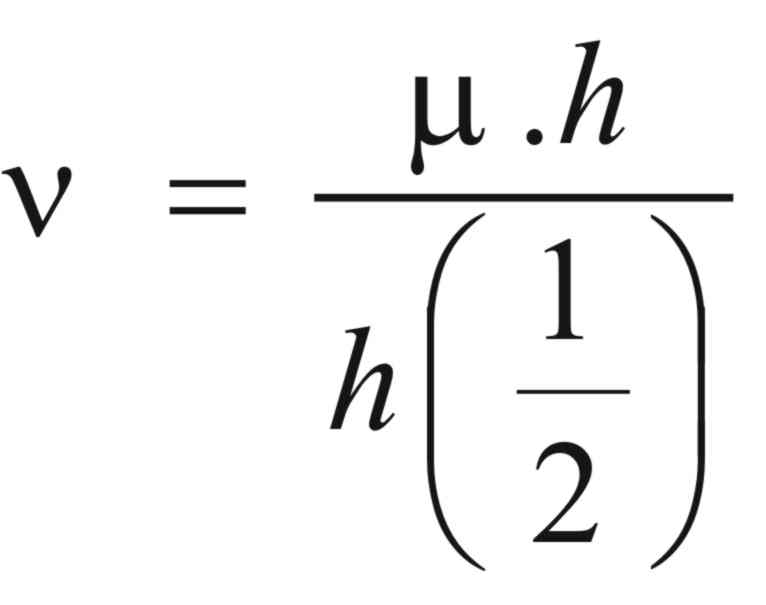 (2)
(2)
-
|
where (μ)
|
is the nuclear magnet moment,
|
|
(H)
|
is the external magnetic field
strength,
|
|
and (h)
|
is planks constant
|
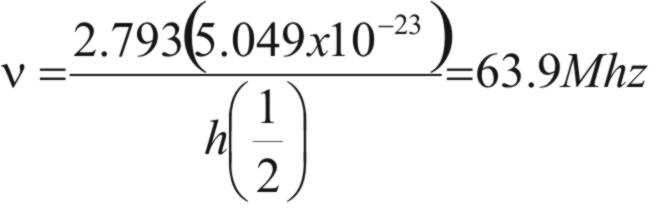
Now the nuclear magnet moment for
the proton is 2.793 Bohr magnetrons (1 magnetron = 5.093 x
10-24 erg/gauss) and thus, if it is situated in a field of
15,000 Gauss, the frequency required to make the transition is given
by,
Employing the same equation and
taking a range of transition frequencies, the different field
strengths can be calculated for different frequencies and different
nuclei. The results of such calculations are shown in Table 1.
Table 1. NMR Field Strengths
and Frequencies for Some Different Nuclei
|
Nucleus
|
20 MHz
|
60 MHz
|
100 MHz
|
250 MHz
|
750 MHz
|
|
1H
|
4,700
|
14,000
|
23,500
|
58,750
|
176,250
|
|
2H
|
30,600
|
91,800
|
153,000
|
382,500
|
1,147,500
|
|
13C
|
18,700
|
56,00
|
93,400
|
233,750
|
701,250
|
|
14N
|
65,000
|
195,000
|
325,000
|
812,500
|
2,437,500
|
Consider a sample containing different protons, is
situated in a strong magnetic field and irradiated at the transition
frequency. Assume the sample is then scanned by a second, low
intensity magnetic field, When the transition of a proton actually
occurs, energy will be absorbed and that energy can be electronically
detected.
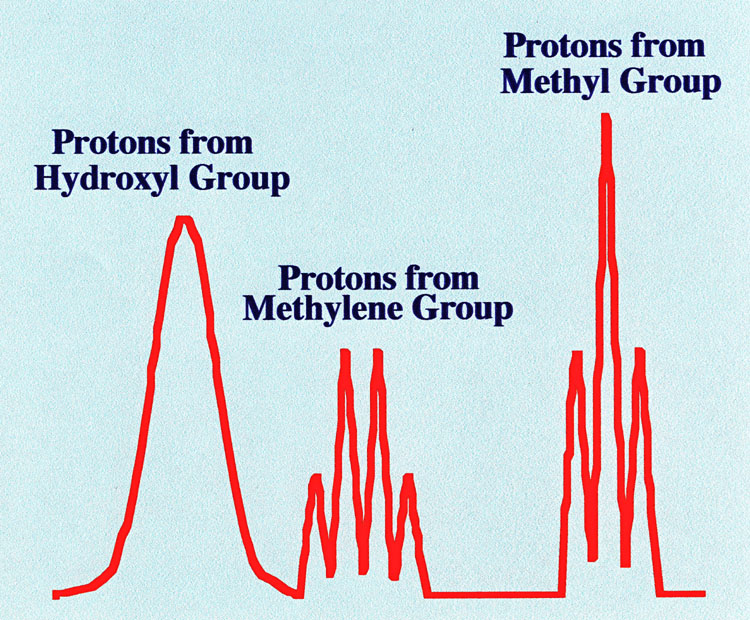
The Spectrum obtained for alcohol
is shown in figure 4. The device has been examined on a low-resolution
spectrometer. The sample has been irradiated with electromagnetic waves of
the calculated frequency and the intensity of the magnetic field was
then scanned over a narrow range close to that where the absorption
of energy was expected to take place. The energy of absorption, which
is sensed electronically, is shown plotted against field strength to
provide the NMR Spectrum. There are several points of interest
arising from the resulting simple Spectrum shown in figure 3. First,
it can be shown that the three peaks have areas in the proportions of
1:2:3 which would indicate that they arise from the proton associated
with the oxygen atom, the methylene protons and the methyl protons.
Thus,
the
spectrum
discloses
the relative
number
of
protons
associated with each peak from
the relative peak areas.
Second, the proton peaks appear at
different values of the scanned magnetic field. This is because, due
to their specific environment, they experience shielding from the
electron clouds from neighbouring atoms. As a consequence, although
all the protons absorb energy at the same frequency (because the
frequency in this experiment is fixed) the applied field must be
different for each type of proton, to compensate for their dissimilar
magnetic environments.
Now,

|
where (H)
|
is the net magnetic field
experienced by the proton,
|
|
(HF)
|
is the high intensity applied
magnetic field,
|
|
(HS)
|
is the small applied scanning
magnetic field,
|
|
and (HC)
|
is the shielding field provided
by the atomic environment of the proton
|
and
HC = α(HF+HS) (3)
Where (α)
is the shielding effect of the electron environment of the proton.
Thus, H = HF+HS -α(HF+HS)
or, H= (HF+HS)(1-α) (4)
In fact it is the chemical
environment of the proton that will affect the diamagnetic
shielding constant (α).
Consequently, the relative positions of the absorption peaks, called
the ‘chemical shift’ will be
determined by the magnitude of (α)
and will disclose the nature of the chemical environment and
contribute information with regard to the overall structure of the
molecule.
Thus, the position of the peaks, the chemical
shift, discloses the nature of the chemical environment of the proton
and consequently, contributes to the elucidation of the chemical
structure.
If the resolution of the NMR machine
is increased (which, in practice, will mean that the widths of the
peaks are reduced relative to their movement apart, viz. chemical
shift) then the proton peaks will show a well-defined and
predictable fine structure. An example of the Spectrum of ethyl
alcohol that would be obtained on a NMR spectrometer having greater
resolution is shown in figure 4
The Spectrum shows that the magnetic
field affecting the environment of a given proton is also influenced
by protons on the adjacent
carbon atoms. For example, the methylene protons can
contribute magnetic influence at three different levels to the field
experienced by the methyl protons. The magnetic fields due to the
each methylene proton can act in opposite directions or both in one
direction or the other. Thus, as there are three different
contributions, the methyl protons will
display three peaks. Furthermore, as the probability of both protons
acting in the same direction is half that of them acting in
opposition, the centre peak will be twice the height of the side
peaks.
In a similar way, the three protons
of the methyl group can contribute fields at four different levels to
the methylene protons. There are two possibilities for them all to
act in one direction and two possibilities where two are acting in
one direction and the other in opposition. Thus the methylene
protons will display four peaks. As the probability of the two
protons acting in one direction and the other in opposition is twice
as great as all the protons acting in one direction or the other, the
two centre peaks will be twice the height of the outside peaks.
As already stated the position
of the peaks (the chemical shift) indicates
the chemical nature of the neighbouring groups. The fine
structure of the proton peaks provides information on the
degree of the proton saturation of the
neighbouring atoms. In addition, the area of the peaks
provides quantitative information on the distribution of the protons
throughout the molecule. Even with this brief and somewhat
superficial treatment of NMR spectroscopy, the value of the technique
to the analyst for substance identification and for structure
elucidation becomes quite obvious.
For those requiring more information on NMR, the books by P.J.
Hore (1) and Paudler (2) are strongly recommended.
About the Author
RAYMOND PETER WILLIAM SCOTT was born on June 20 1924 in Erith, Kent, UK. He studied at the
University of London, obtaining his B.Sc. degree in 1946 and his D.Sc. degree in 1960.
After spending more than a decade at Benzole Producers, Ltd. Where he became head of
the Physical Chemistry Laboratory, he moved to Unilever Research Laboratories as
Manager of their Physical Chemistry department. In 1969 he became Director of Physical
Chemistry at Hoffmann-La Roche, Nutley, NJ, U.S.A. and subsequently accepted the position
of Director of the Applied Research Department at the Perkin-Elmer Corporation, Norwalk, CT, U.S.A.
In 1986 he became an independent consultant and was appointed Visiting Professor at Georgetown
University, Washington, DC, U.S.A. and at Berkbeck College of the University of London; in 1986
he retired but continues to write technical books dealing with various aspects of physical chemistry
and physical chemical techniques. Dr. Scott has authored or co-authored over 200 peer reviewed
scientific papers and authored, co-authored or edited over thirty books on various aspects of
physical and analytical chemistry. Dr. Scott was a founding member of the British chromatography
Society and received the American Chemical society Award in chromatography (1977), the
M. S. Tswett chromatography Medal (1978), the Tswett chromatography Medal U.S.S.R., (1979),
the A. J. P. Martin chromatography Award (1982) and the Royal Society of Chemistry Award in
Analysis and Instrumentation (1988).
Dr. Scott’s activities in gas chromatography started at the inception of the technique,
inventing the Heat of Combustion Detector (the precursor of the Flame Ionization Detector),
pioneered work on high sensitivity detectors, high efficiency columns and presented fundamental
treatments of the relationship between the theory and practice of the technique.
He established the viability of the moving bed continuous preparative gas chromatography,
examined both theoretically and experimentally those factors that controlled dispersion
in packed beds and helped establish the gas chromatograph as a process monitoring instrument.
Dr. Scott took and active part in the renaissance of liquid chromatography,
was involved in the development of high performance liquid chromatography and invented
the wire transport detector. He invented the liquid chromatography mass spectrometry
transport interface, introduced micro-bore liquid chromatography columns and used them
to provide columns of 750,000 theoretical plates and liquid chromatography separations
in less than a second.
Dr. Scott has always been a “hands-on” scientist with a remarkable record of accomplishments in chromatography ranging from hardware design to the development of fundamental theory. He has never shied away from questioning “conventional wisdom” and his original approach to problems has often produced significant breakthroughs.