The sample must be in good contact
with the hot graphite surface for as long as possible and be in a
uniform temperature environment to ensure good element selectivity.
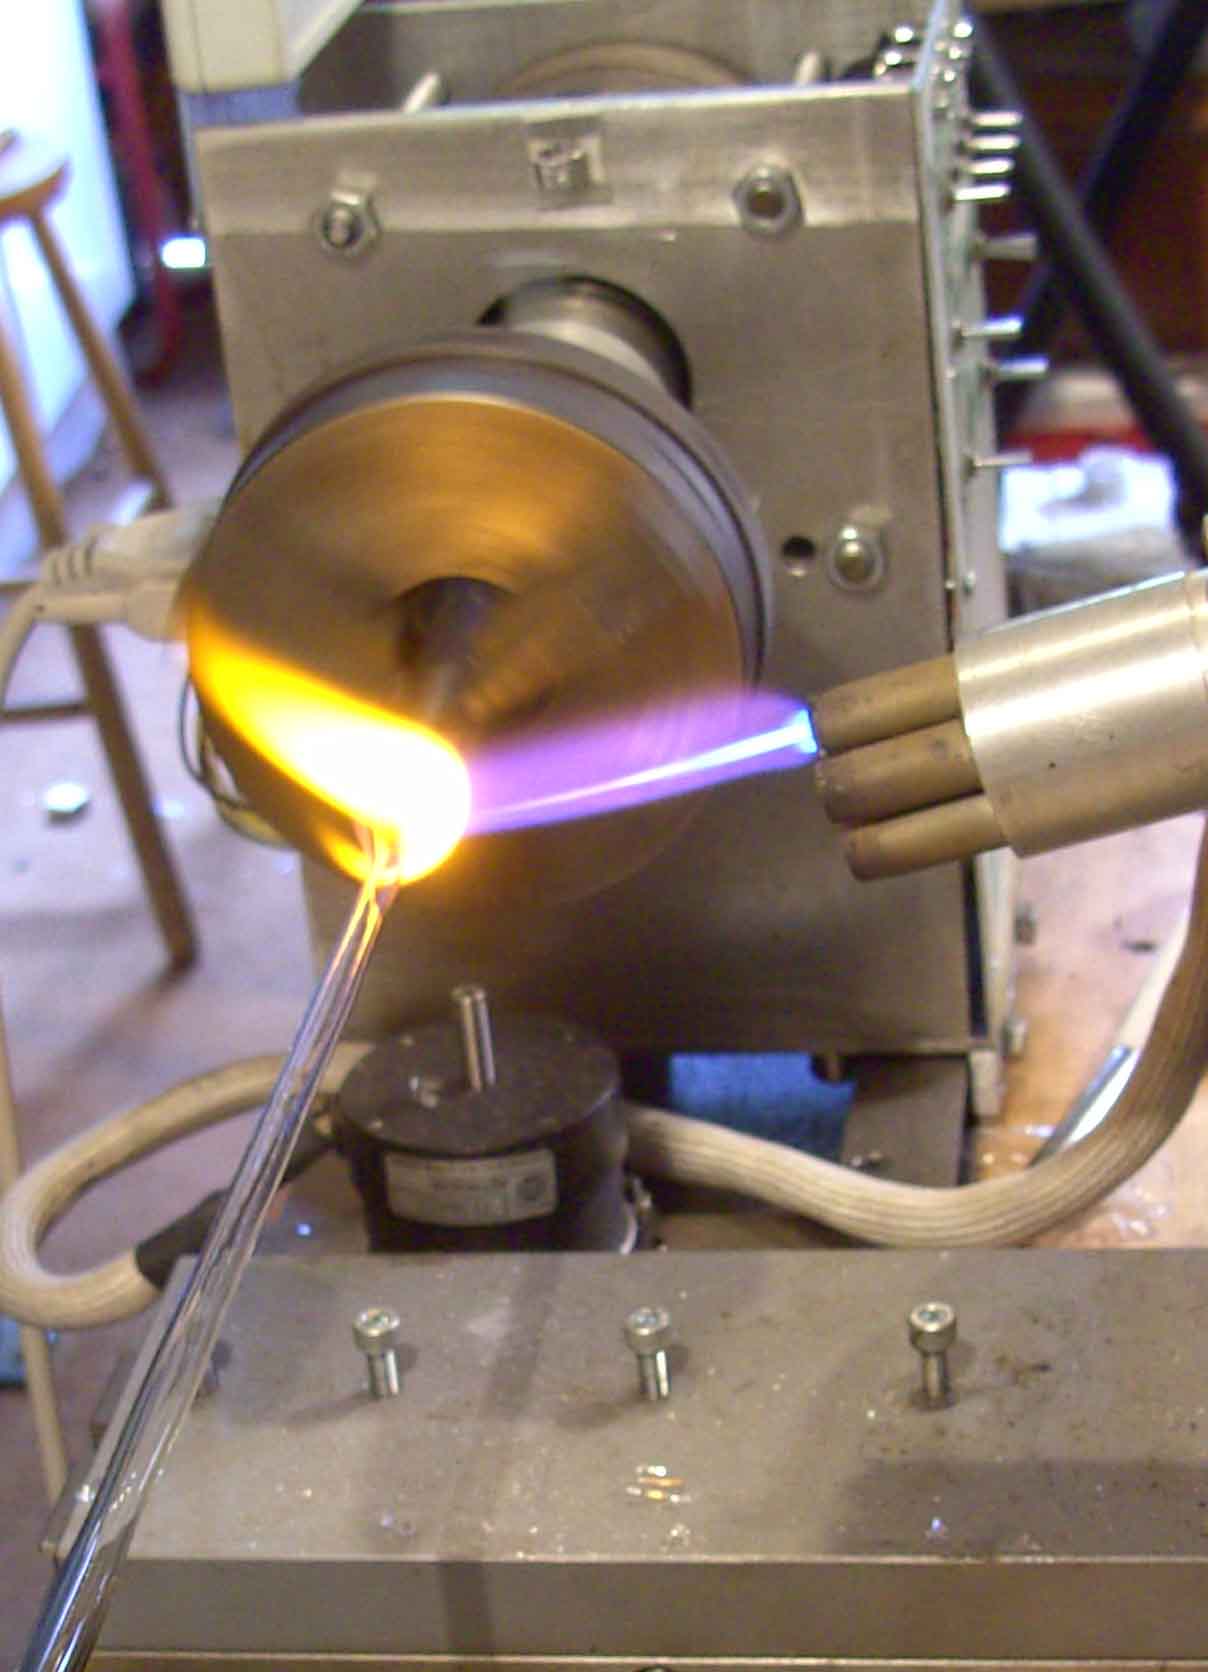
The sample has intimate contact with a flame although for a
limited time. If the sample is applied directly to the wall of a
cold Graphite Furnace and subsequently stepwise heated to a high
temperature, however, the tube wall will heat faster than the gas
producing temperature differentials.
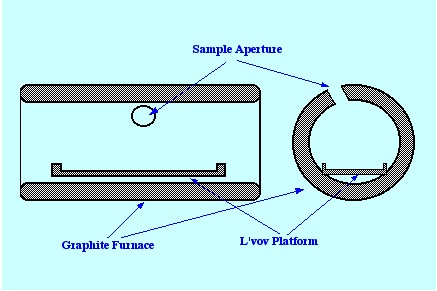
The poor uniformity of temperature
can cause condensation or recombination of atoms. L’vov
suggested that a small graphite platform coated with pyrolytic carbon
was inserted in the furnace. A diagram of a furnace containing a
L’vov Platform is shown in figure 19. The platform was heated
by radiation from the hot walls and by the hot gas molecules; thus,
the vaporization an Atomization was delayed until the tube had
obtained constant temperature. The net result was that the sample was
always vaporized into an environment that was hotter than the surface
from which it left. As a consequence, the chance of condensation and
recombination was significantly reduced and any molecular species
that were rendered volatile were more likely to suffer dissociation.
The L’vov Platform has shown a great improvement in
performance, particularly sensitivity, and without surface
modification. Matrix modification has shown even greater improvement
in performance. The relative performance of a simple pyrolytic carbon
tube, a standard graphite tube and a graphite tube containing a L’vov
platform is shown in figure 20.
The platforms are often prepared from
a pyrolytically coated graphite tray that has been further heated
after treatment with a tantalum solution.
It was also found that the
sensitivity of the analysis employing the graphite tube was improved
by inserting a tungsten or tantalum tube inside the graphite tube and
depositing the sample on the metal surface (as opposed to that of the
graphite tube). It appeared that the metal surface acted in a similar
way to the L’vov Platform. It was found that, by this procedure
that detection limit for some 23 elements could be lowered by 3 to
100 fold and, at the same time, reduce the Atomization temperature by
200 to 900 C.
The possible use of wire filaments
and springs have also been examined and various degrees of improved
performance obtained.
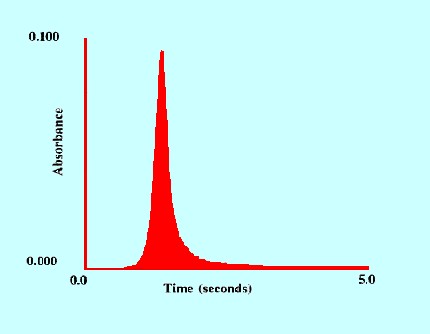
(Sample 1 ppm of Arsenic)
An example of the performance of the
commercially available Perkin Elmer AAnalyst 700 instrument is shown
in figure 21. The advantages of the technique for trace analysis is
clearly demonstrated.
When a quantum of light is emitted,
the atom responsible suffers a change in energy level (i.e
from E2
to E1
where E2
>E1).
Thus, the change in energy, from equation (1), (ΔE)
is given by,
ΔE =
E2
– E1
= hν.
Courtesy
of the Perkin Elmer Corporation
Thus if (λ)
is the wavelength of the light and (c)
is the velocity of light,
Then,
c = νλ
thus, ΔE
= hc/λ
Consequently, the energy change is
proportional to the reciprocal of the light emitted and thus, the
greater the energy change the shorter its wavelength. The emission
Spectrum of the element hydrogen is shown in figure 22.
The Spectrum lines show a regular
increase in frequency (decrease in wavelength) as the lines progress
towards the lower frequencies.
The series of lines is called the
Balmer Series after Balmer who deduced
the following relationship for the wavelength of the emitted light;
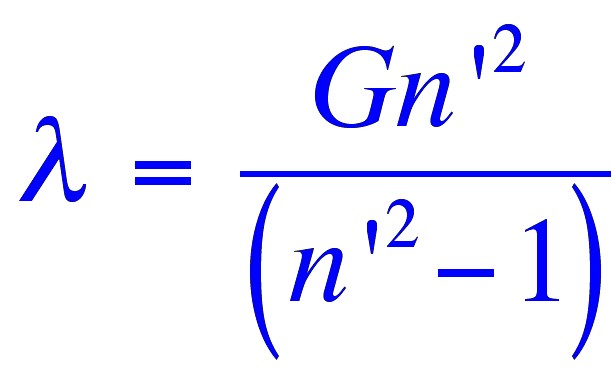
where (λ)
is the wavelength of the light,
(n’)
is a member of a series of consecutive integers starting with three.
and (G)
is a constant.
In figure 23
the value for (n’) the first line
of the series shown at a wavelength of 656.3 nm (65639Å) is 3
(the values of the other lines in the series are 486.1 Å, 434.0
Å, 410 .2 Å 399.8 Å that correspond to values of n=
4,5 and 6 respectively).
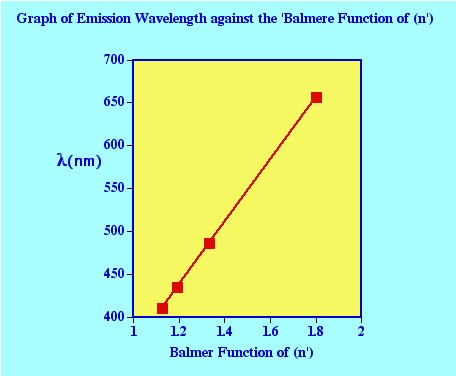
It is clear from the graph that the
higher the energy change the shorter the wavelength of the emitted
photon and that the individual spectral lines become closer and
closer together. Examination of the equation of Balmer, it is seen
that by simple algebraic manipulation and noting that, ν
= c/λ,
Ballmer’s equation can be put in the form of ,
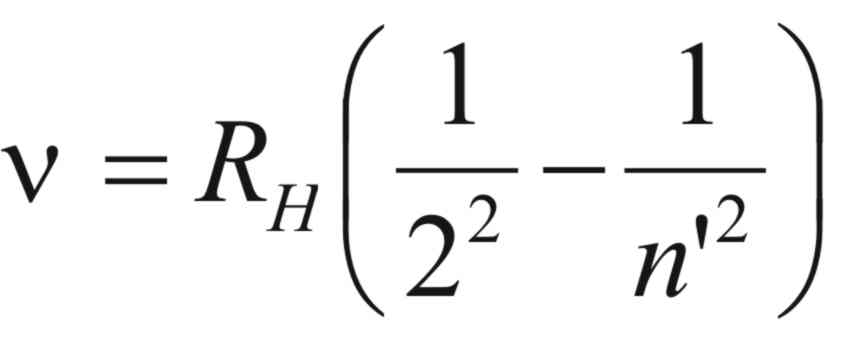
where, (RH)
is known as Rydberg’s constant.
Rydberg’s constant, (RH),
is given by the following equation,
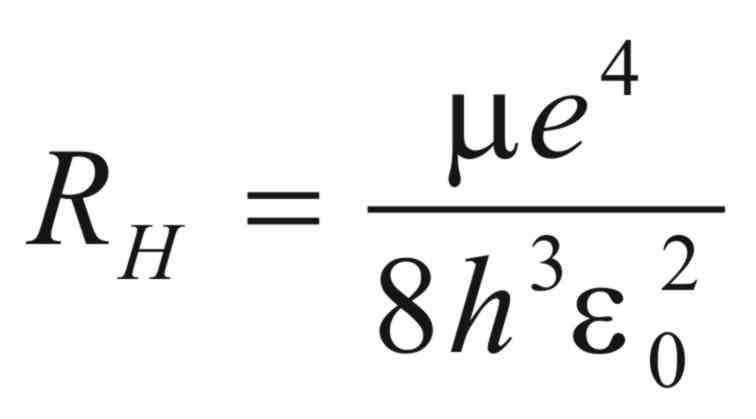
where (e)
is the charge on the electron,
(h)
is Plank’s constant,
(εo)
is the Vacuum Permativity,
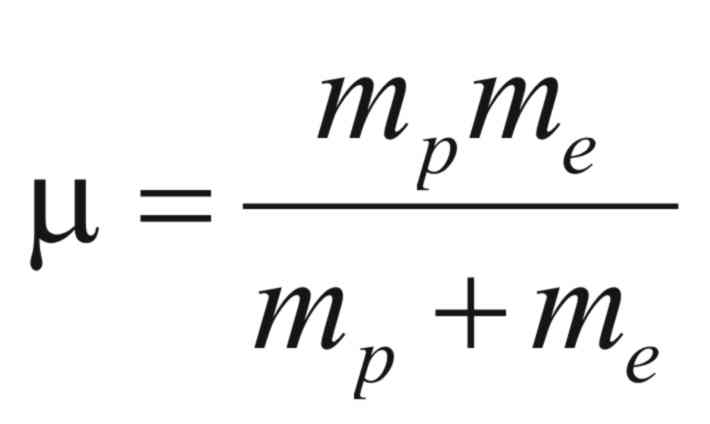
and (μ)
is reduced mass of the electron and proton and is given by,
It is interesting to observe that the
number of electrons involved becomes greater as the atomic weight of
the element becomes greater. The atomic Spectrum of helium is shown
in figure 24

In the Spectrum shown in figure 22 the spectral
lines are closely matched to the precise wavelengths given on the
wavelength scale. However, in the spectra given in figures 24 and 25
the relationship between the lines and the scale are not so precise
but are sufficiently accurate to give a correct impression of the
forms of the spectral line distribution. It is clearly seen that
there are considerably more lines in the Visible region spectra and
this is because the extra electron in orbit round the nucleus adds
many energy levels to the atom and, thus, many more emission lines
are apparent.
The increased complex nature of the line pattern
is emphasized by the Spectrum for nitrogen shown in figure 24. As the
atomic number increases and, thus, the number of electrons orbiting
the nucleus also increase then the number of lines can increase
immensely.

It should
be noted that nitrogen has only an atomic number of 14 and one of the
popular areas of application for Atomic Spectroscopy is for the
detection and analysis of trace levels of heavy metals. However, it
should also be pointed out that all the emission lines are not of the
same intensity and in practice the number of lines examined for
identification purposes or quantitative assessment can be relatively
few. The line wavelengths chosen are usually from those having
relatively high intensity and of wavelengths that are appropriate for
the measuring spectrometer involved and unique the element of
interest.
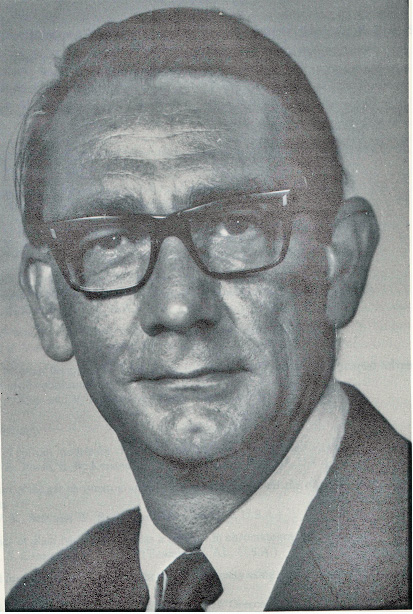
About the Author
RAYMOND PETER WILLIAM SCOTT was born on June 20 1924 in Erith, Kent, UK. He studied at the
University of London, obtaining his B.Sc. degree in 1946 and his D.Sc. degree in 1960.
After spending more than a decade at Benzole Producers, Ltd. Where he became head of
the Physical Chemistry Laboratory, he moved to Unilever Research Laboratories as
Manager of their Physical Chemistry department. In 1969 he became Director of Physical
Chemistry at Hoffmann-La Roche, Nutley, NJ, U.S.A. and subsequently accepted the position
of Director of the Applied Research Department at the Perkin-Elmer Corporation, Norwalk, CT, U.S.A.
In 1986 he became an independent consultant and was appointed Visiting Professor at Georgetown
University, Washington, DC, U.S.A. and at Berkbeck College of the University of London; in 1986
he retired but continues to write technical books dealing with various aspects of physical chemistry
and physical chemical techniques. Dr. Scott has authored or co-authored over 200 peer reviewed
scientific papers and authored, co-authored or edited over thirty books on various aspects of
physical and analytical chemistry. Dr. Scott was a founding member of the British chromatography
Society and received the American Chemical society Award in chromatography (1977), the
M. S. Tswett chromatography Medal (1978), the Tswett chromatography Medal U.S.S.R., (1979),
the A. J. P. Martin chromatography Award (1982) and the Royal Society of Chemistry Award in
Analysis and Instrumentation (1988).
Dr. Scott’s activities in gas chromatography started at the inception of the technique,
inventing the Heat of Combustion Detector (the precursor of the Flame Ionization Detector),
pioneered work on high sensitivity detectors, high efficiency columns and presented fundamental
treatments of the relationship between the theory and practice of the technique.
He established the viability of the moving bed continuous preparative gas chromatography,
examined both theoretically and experimentally those factors that controlled dispersion
in packed beds and helped establish the gas chromatograph as a process monitoring instrument.
Dr. Scott took and active part in the renaissance of liquid chromatography,
was involved in the development of high performance liquid chromatography and invented
the wire transport detector. He invented the liquid chromatography mass spectrometry
transport interface, introduced micro-bore liquid chromatography columns and used them
to provide columns of 750,000 theoretical plates and liquid chromatography separations
in less than a second.
Dr. Scott has always been a “hands-on” scientist with a remarkable record of accomplishments in chromatography ranging from hardware design to the development of fundamental theory. He has never shied away from questioning “conventional wisdom” and his original approach to problems has often produced significant breakthroughs.