Specialising in custom-designed, precision scientific instruments, built, programmed and calibrated
to the most exacting standards. The range includes precision dataloging barographs,
with built-in statistical analysis, Barographic Transient Event Recorders
and computer-interfaced detectors and sensors
for environmental monitoring & process control.
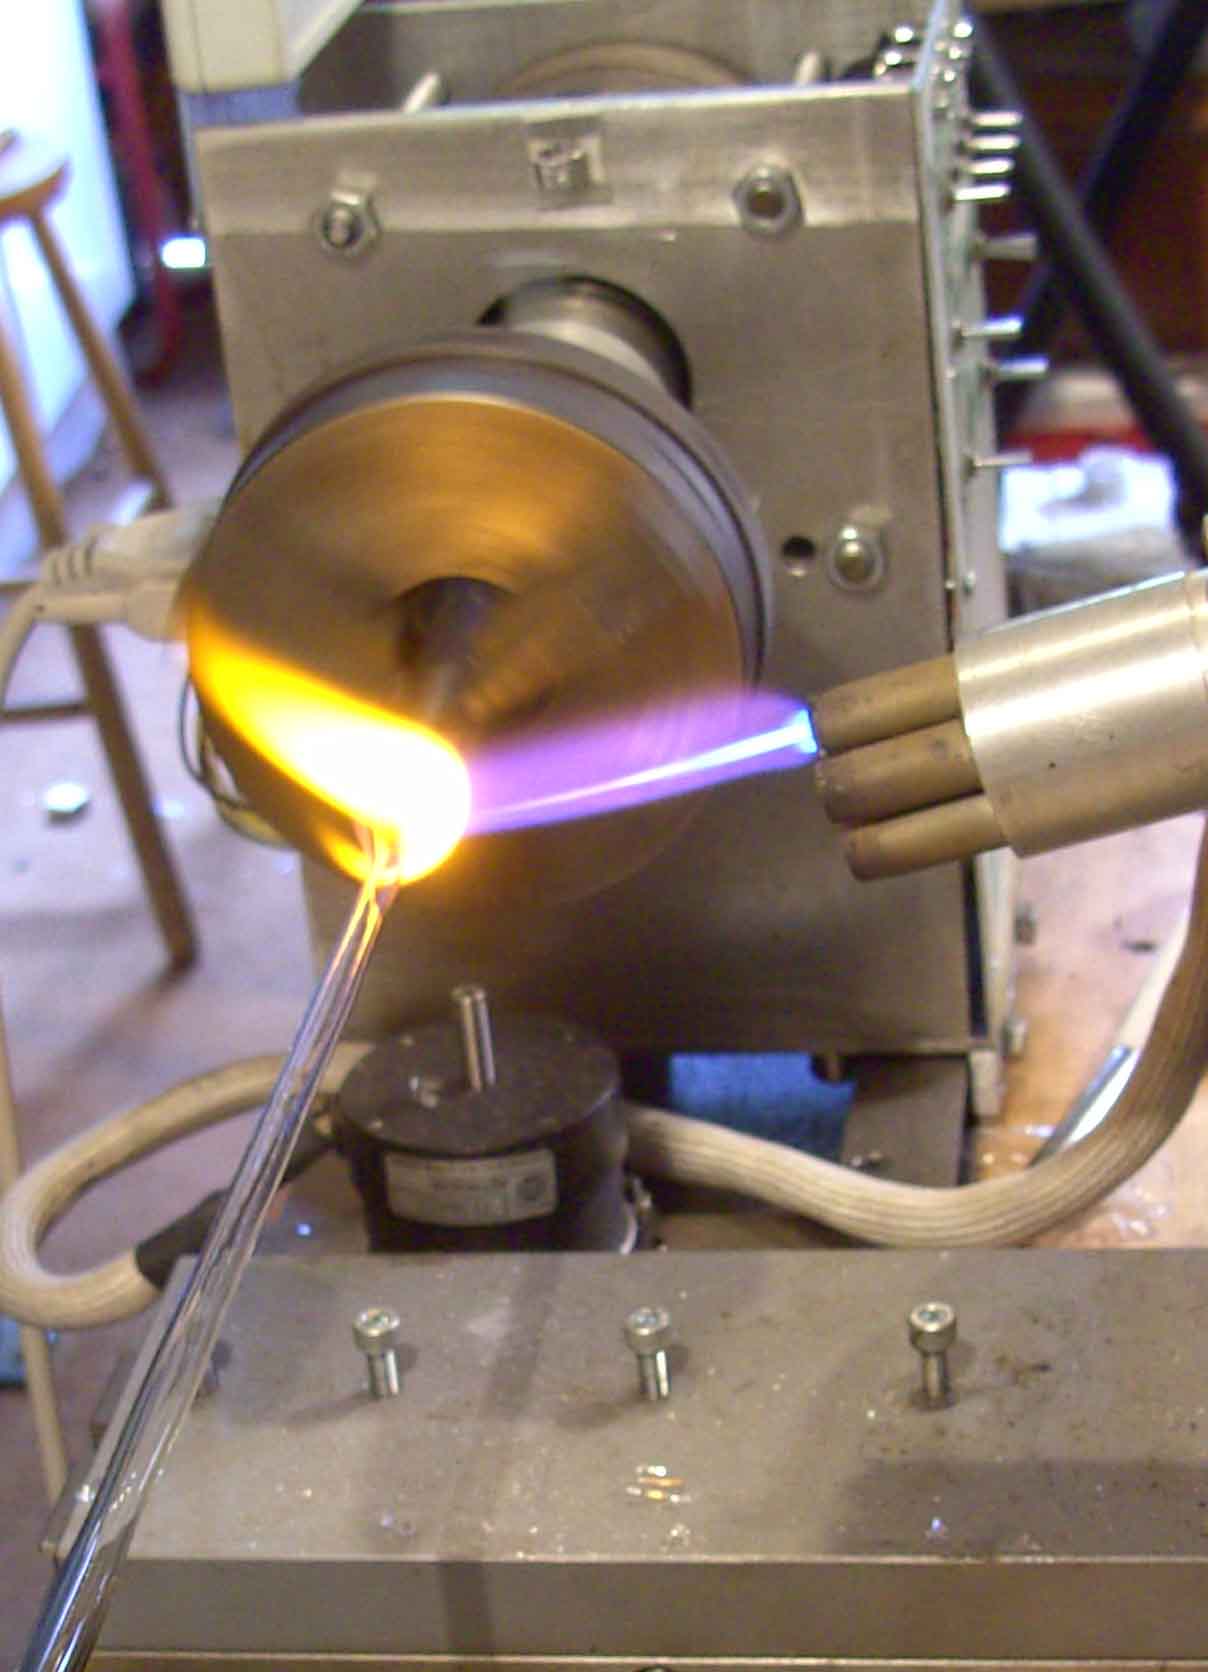
A site dedicated to scientific techniques, experimental methods, &
investigative tools for the inventor, researcher
and laboratory pioneer. Articles on glassblowing, electronics, metalcasting, magnetic
measurements with new material added continually. Check it out!
www.drkfs.net
The
majority of molecules exist at their lowest vibrational level in
their ground state at room temperature. On exposure to
electromagnetic radiation the molecules can absorb energy and, as a
consequence, are promoted to an excited state. As a result of the
energy absorption, the molecule can attain any of the vibrational
sub-levels associated with each electronic state. Because
electromagnetic energy can only be absorbed in discrete quanta it
would appear that this should result in a series of absorption bands
in the absorption Spectrum. However, superimposed on the various
vibrational energy levels are a series of rotational energy levels,
which result in so many absorption bands that it becomes practically
impossible to resolve and, thus, depict all the individual bands in
the Spectrum. As a consequence, most compounds excluding planar and
aromatic compounds (where the rotation energy levels are limited)
produce broad absorption spectra with little fine structure (see book
1 on UV and Visible Spectroscopy).
Having
been excited and reached a high vibrational energy level, the
vibrational energy is lost by molecular collision and the molecule
is, thus, reduced to the lowest vibrational energy of its excited
state. Subsequently the molecule will suffer internal conversion
where there is an energy transfer from the lowest vibrational energy
at the upper excited state to a higher vibration energy level at a
lower excited state. This process will continue until the molecule
reaches its lowest vibrational energy at its first excited state.
From this condition the molecule can return to any vibrational level
of the ground state with emission of a photon of energy in the form
of Fluorescence.
If
all the excited molecules return to the ground state the quantum
efficiency is said to be unity, The return of the energy level from
the first excited sate to the ground state is the reverse of the
absorption process where a photon of radiation is absorbed and the
molecule is raised from the ground state to the first excited state.
It follows that the Fluorescence emission Spectrum could be expected
to coincide with the absorption Spectrum at the first transition
energy although the rest of the Spectrum to be of lower energy or at
a longer wavelength. This in fact does not occur as depicted in
figure 1.
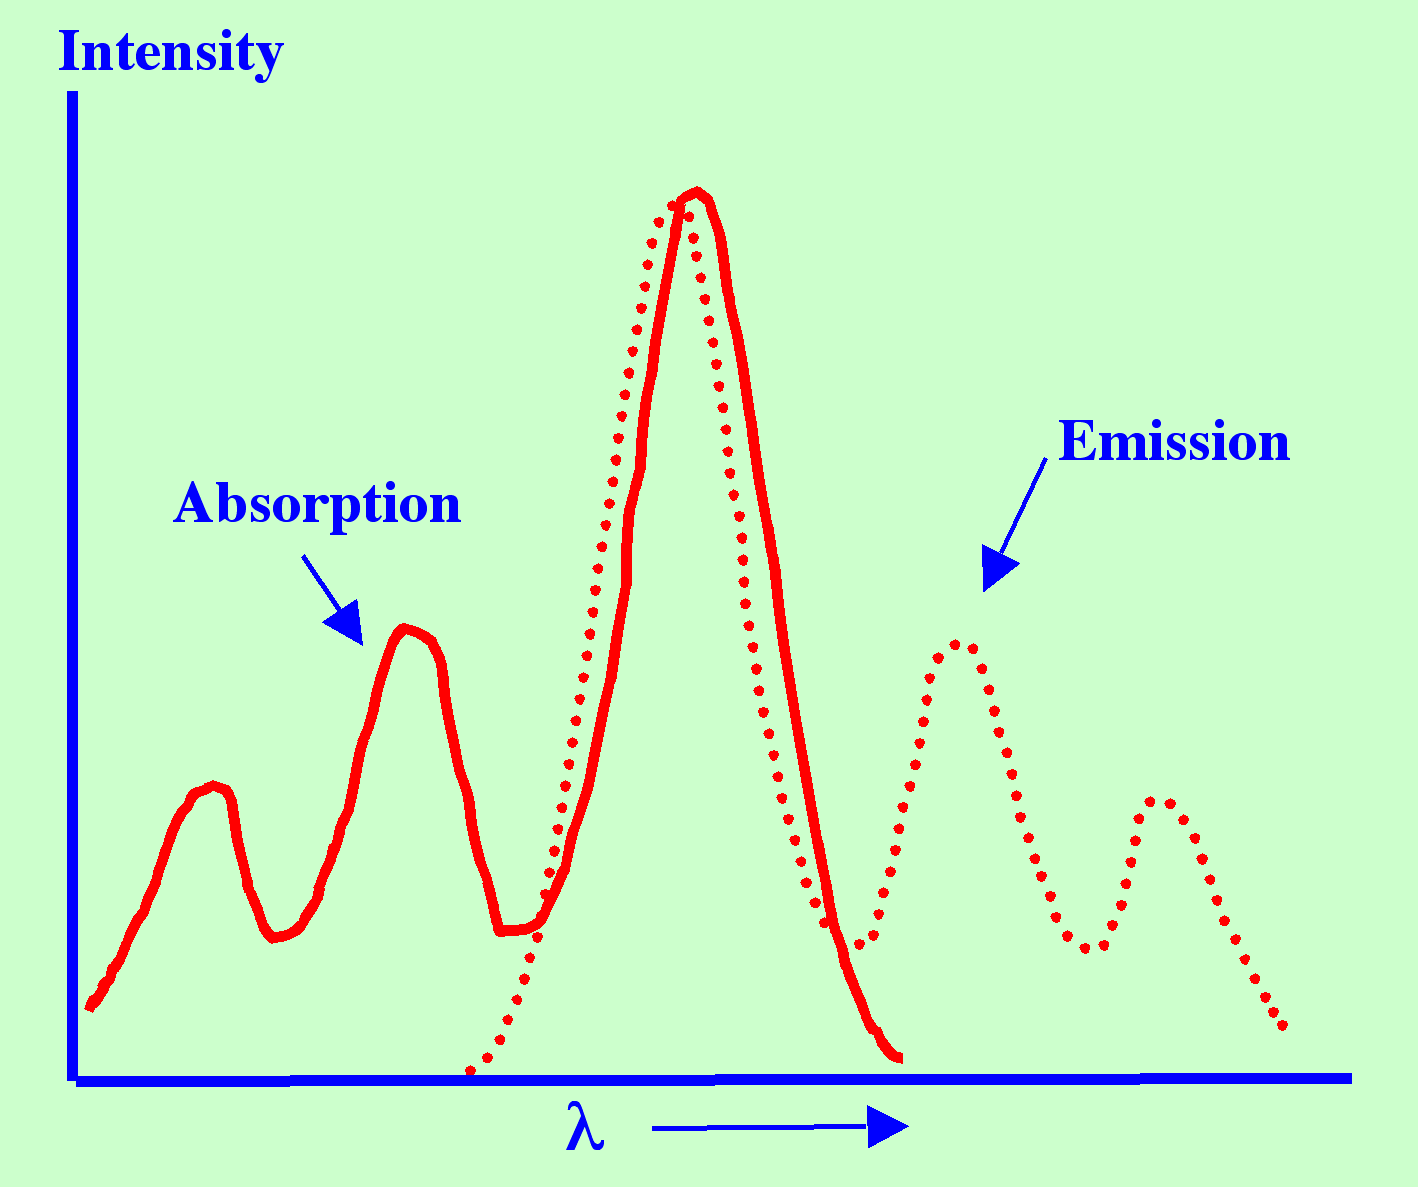
In
fact, this coincidence rarely occurs, as there is usually a small
loss of energy due to interaction with the surrounding solute or
solvent molecules.
It
is clear that there will be three basic types of fluorescent spectra
that can be taken:
(a) The
Fluorescence intensity is measured while programming the excitation
wavelength. This is called an excitation Spectrum.
(b) The
Fluorescence intensity is measured while programming the excitation
wavelength but maintaining the excitation light at a constant
intensity. This is called a corrected excitation Spectrum.
(c)The
Fluorescence measured is taken over a range of wavelengths while
employing a fixed excitation wavelength which is called an emission
Spectrum.
Examples
of a pair of spectra obtained by recording the Fluorescence intensity
taken while programming the excitation wavelength and by recording
the Fluorescence intensity over a range of wavelengths while
employing a fixed excitation wavelength are given in figure 2.
.
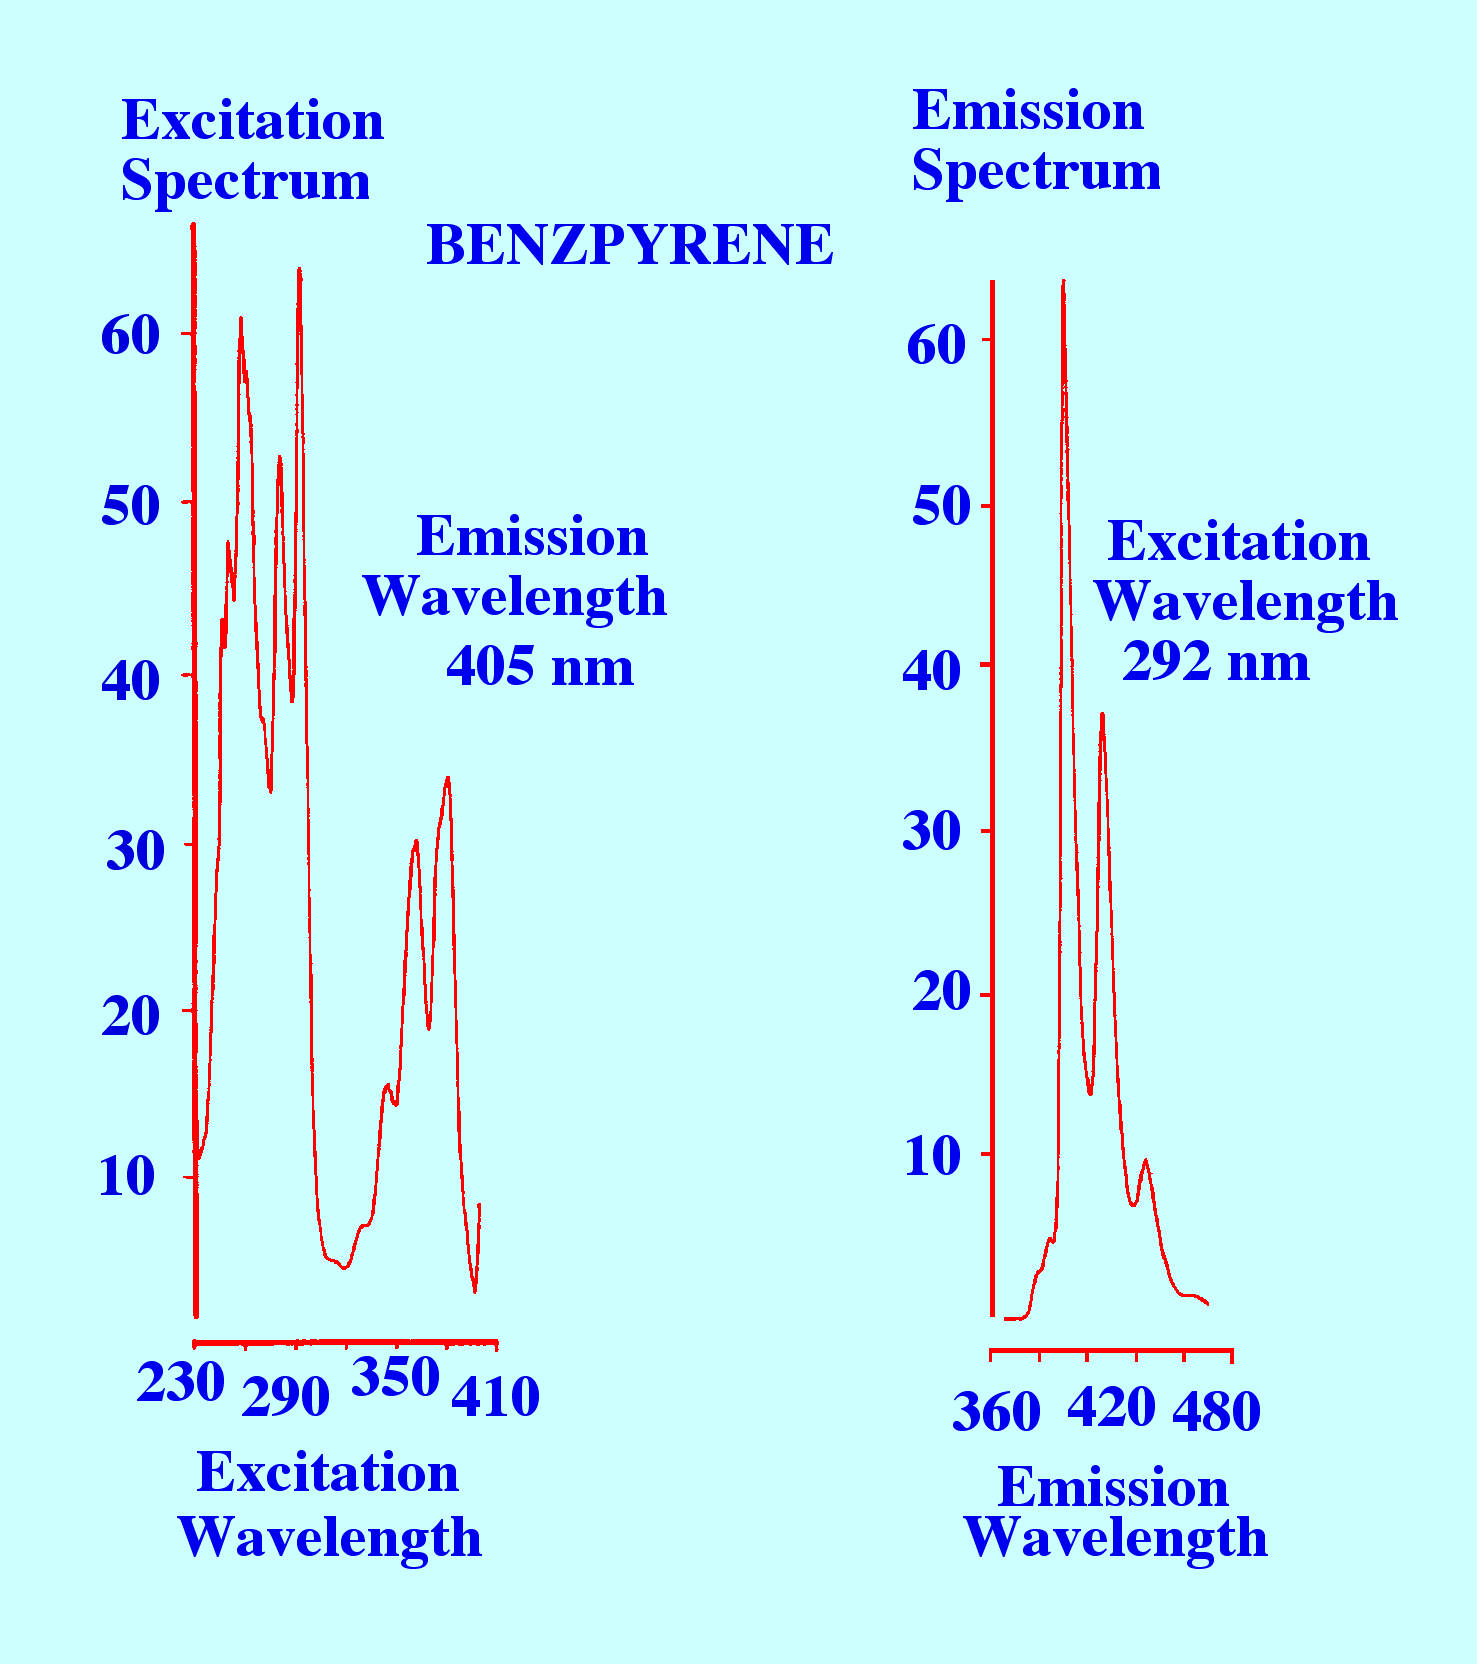
Courtesy of the
Perkin Elmer Corporation
Figure
2. Two Fluorescence Spectra: the First Monitored at 405 nm and the
second Excited at 292 nm
The
Spectrum on the left was obtained by monitoring the Fluorescence at
405 nm and programming the excitation light from 230 nm to 410 nm,
and thus, provides an excitation Spectrum. The Spectrum on the right
is obtained by fixing the excitation light at 292 nm and monitoring
the fluorescent light from 360 nm to 480 nm, and thus, provides an
emission Spectrum. Fluorescence spectra can be used for identifying
substances by comparing them with reference spectra. However, they
have rather limited use for the structure elucidation of a completely
unknown substance.
It
is seen that there is a considerable amount of fine structure present
in both spectra, which means that if reference spectra are available
compound identification could be confirmed with a fair degree of
certainty.
About the Author
RAYMOND PETER WILLIAM SCOTT was born on June 20 1924 in Erith, Kent, UK. He studied at the
University of London, obtaining his B.Sc. degree in 1946 and his D.Sc. degree in 1960.
After spending more than a decade at Benzole Producers, Ltd. Where he became head of
the Physical Chemistry Laboratory, he moved to Unilever Research Laboratories as
Manager of their Physical Chemistry department. In 1969 he became Director of Physical
Chemistry at Hoffmann-La Roche, Nutley, NJ, U.S.A. and subsequently accepted the position
of Director of the Applied Research Department at the Perkin-Elmer Corporation, Norwalk, CT, U.S.A.
In 1986 he became an independent consultant and was appointed Visiting Professor at Georgetown
University, Washington, DC, U.S.A. and at Berkbeck College of the University of London; in 1986
he retired but continues to write technical books dealing with various aspects of physical chemistry
and physical chemical techniques. Dr. Scott has authored or co-authored over 200 peer reviewed
scientific papers and authored, co-authored or edited over thirty books on various aspects of
physical and analytical chemistry. Dr. Scott was a founding member of the British chromatography
Society and received the American Chemical society Award in chromatography (1977), the
M. S. Tswett chromatography Medal (1978), the Tswett chromatography Medal U.S.S.R., (1979),
the A. J. P. Martin chromatography Award (1982) and the Royal Society of Chemistry Award in
Analysis and Instrumentation (1988).
Dr. Scott’s activities in gas chromatography started at the inception of the technique,
inventing the Heat of Combustion Detector (the precursor of the Flame Ionization Detector),
pioneered work on high sensitivity detectors, high efficiency columns and presented fundamental
treatments of the relationship between the theory and practice of the technique.
He established the viability of the moving bed continuous preparative gas chromatography,
examined both theoretically and experimentally those factors that controlled dispersion
in packed beds and helped establish the gas chromatograph as a process monitoring instrument.
Dr. Scott took and active part in the renaissance of liquid chromatography,
was involved in the development of high performance liquid chromatography and invented
the wire transport detector. He invented the liquid chromatography mass spectrometry
transport interface, introduced micro-bore liquid chromatography columns and used them
to provide columns of 750,000 theoretical plates and liquid chromatography separations
in less than a second.
Dr. Scott has always been a “hands-on” scientist with a remarkable record of accomplishments in chromatography ranging from hardware design to the development of fundamental theory. He has never shied away from questioning “conventional wisdom” and his original approach to problems has often produced significant breakthroughs.